0x9B4B Free Telemetry
Some time ago I wrote about leveraging GCP free tier for log collection. I also started using it for telemetry though I never updated the post with those details.
Since Google refactored their Monitoring away from that crappy StackDriver interface, it’s actually quite nice, so might as well write the setup down (up? ☁️).
Even though GCP monitoring seems oriented to metrics from GCP services it also allows you to create logs-based metrics.
This basically allows you to defined rules to extract data points from logs into metrics that can be monitored and alerted on.
First things first: based on that previous post about GCP logging, and assuming you have the setup mentioned there to ship logs to GCP/stackdriver, you can use fluentbit to generate these logs.
~# /opt/td-agent-bit/bin/td-agent-bit -i mem -o stdout
Fluent Bit v1.5.6

[2020/11/24 01:41:24] [ info] [engine] started (pid=21309)
[2020/11/24 01:41:24] [ info] [storage] version=1.0.5, initializing...
[2020/11/24 01:41:24] [ info] [storage] in-memory
[2020/11/24 01:41:24] [ info] [storage] normal synchronization mode, checksum disabled, max_chunks_up=128
[2020/11/24 01:41:24] [ info] [sp] stream processor started
[0] mem.0: [1606182084.325065322, {"Mem.total"=>948084, "Mem.used"=>772048, "Mem.free"=>176036, "Swap.total"=>102396, "Swap.used"=>6608, "Swap.free"=>95788}]
[1] mem.0: [1606182085.325055771, {"Mem.total"=>948084, "Mem.used"=>772088, "Mem.free"=>175996, "Swap.total"=>102396, "Swap.used"=>6608, "Swap.free"=>95788}]
[2] mem.0: [1606182086.325105700, {"Mem.total"=>948084, "Mem.used"=>772904, "Mem.free"=>175180, "Swap.total"=>102396, "Swap.used"=>6608, "Swap.free"=>95788}]
configuration file /etc/td-agent-bit/td-agent-bit.conf would be updated with something like:
...

[INPUT]
    Name cpu
    Tag cpu
    Interval_Sec 10

[INPUT]
    Name mem
    Tag mem
    Interval_Sec 10

...

[OUTPUT]
    Name stackdriver
    google_service_credentials /etc/gcreds.json
    Match *
Logs will then show up in GCP Logs Viewer:

As an extra step, as fluentbit mem outputs bytes, GCP does not allow any transformation of the data and visualization with multiple hostnames is friendlier when using percentage (instead of absolute values), I’ve created a fluenbit math filter.
...
[INPUT]
    Name mem
    Tag mem
    Interval_Sec 10

[FILTER]
    Name math
    Match mem
    Operation div
    Field Mem.used
    Field Mem.total
    Output_field Mem.usage
...
This [FILTER] entry will add Mem.usage to the output (which is Mem.used / Mem.total).
In the Logs Viewer you can then click Actions, Create Metric and set it up.

Type counter will just measure the number of log lines for the given query while distribution will extract an actual value from each line (distribution being the right choice here).
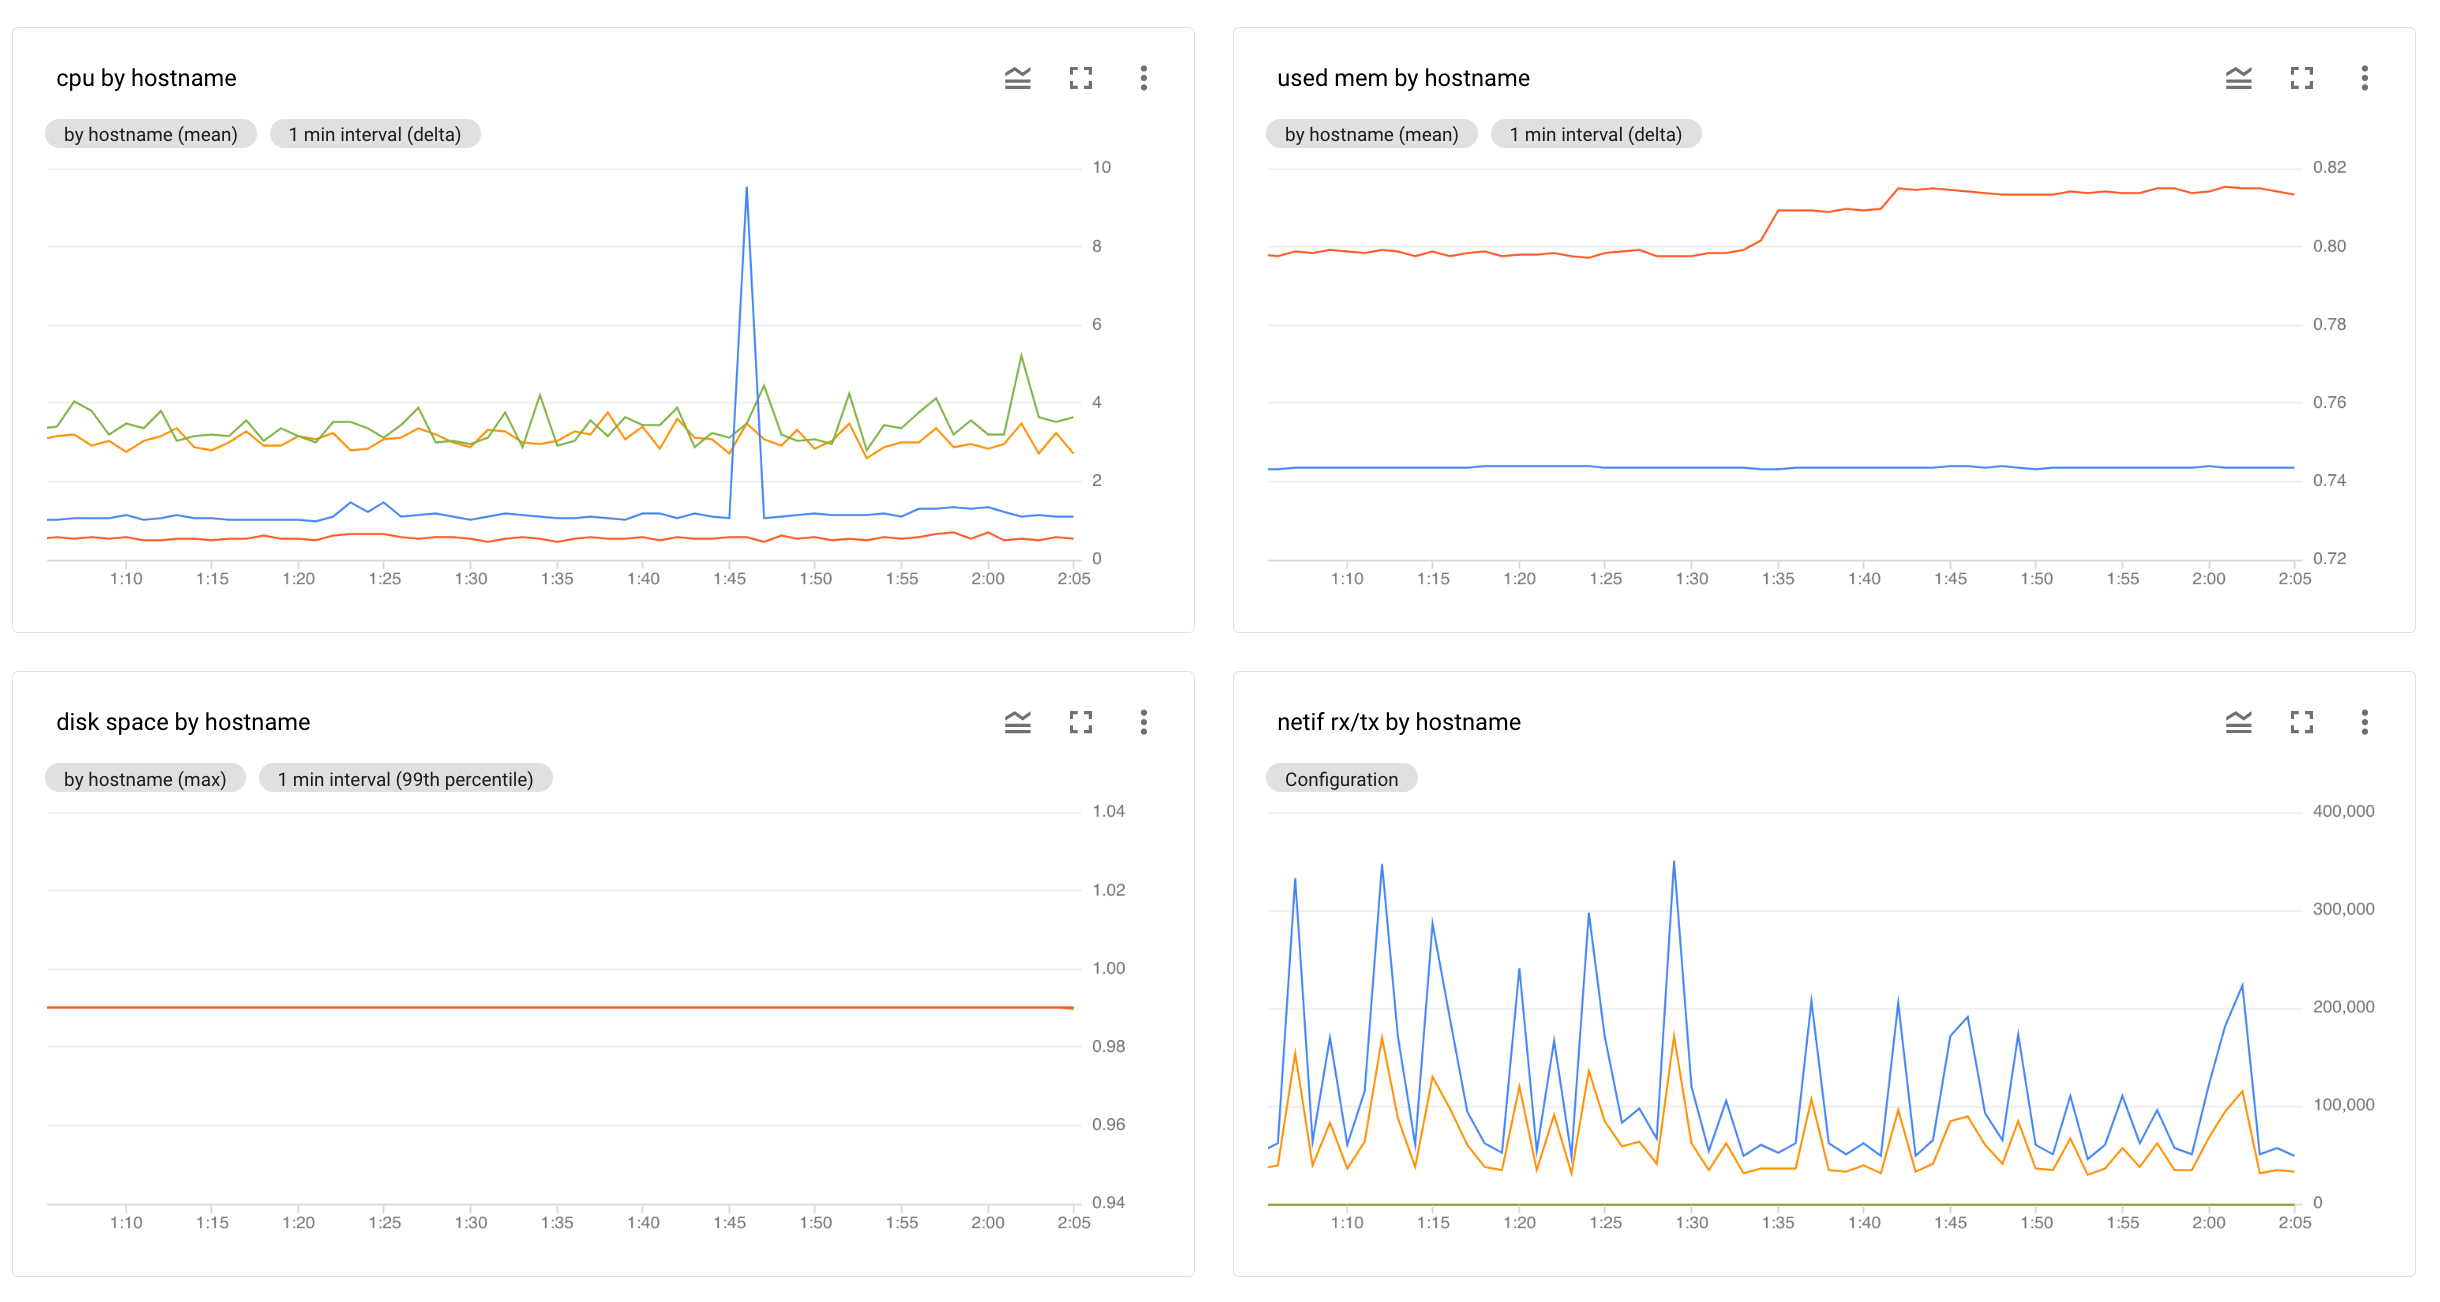
Metric setup, it can now be added to a dashboard and/or used as alert source
Note
These metrics will count both towards logs and metric ingestion limits. At the moment they are respectively 10GB and 150MB (per month).
I have some exclusion filters on the logs (for frequent lines that noone cares). About 10 hosts shipping logs to this (about 30 docker services) and still hardly go above 3GB used for logs.
Metric ingestion does get to 150MB quickly if we start adding a few…