0x474E (In)fluent(a)bit
I’ve moved log collection and telemetry out of GCP Stackdriver (mentioned before) to on-prem InfluxDB (running in a raspberry pi 4 4GB)
FluentBit was the agent of choice at the time but Telegraf seemed like a good candidate now.
Why
fluentd has a lot of plugins but its crappy ruby codebase eats way too many resources for me (why would anyone?) to use it.
Luckily, the same guys gave it an extreme makeover in C and called it fluentbit. Sadly, its community hasn’t grown that much so not so many plugins available out of the box, but making new ones is quite easy: I’ve built this docker image to make it easier to build the plugins and already made a few of my own
As Telegraf is in Go (worse than C but way better than ruby) and it has almost as many plugins available as fluentd, it seemed like a good reason to measure how worse it was resource-wise (than fluentbit) to be able to weight it properly.
How
TL;DR;
- setup telegraf and fluentbit collecting the same metrics: memory, cpu and disk IO
- setup a second telegraf to monitor those two agents (with procstat)
- compare baseline telemetry data to make sure they do the same
- compare telemetry data of the collector processes to weight telegraf resource-hogging
Test Details
Test hardware: raspberry pi 2
All telemetry data goes to an influxdb 2.0.4 instance
- download telegraf
curl -LO https://dl.influxdata.com/telegraf/releases/telegraf-1.17.2_linux_armhf.tar.gz
create test buckets
- test_telegraf
- test_fluentbit
- test_results
install fluentbit
curl https://packages.fluentbit.io/fluentbit.key | sudo apt-key add -
echo deb https://packages.fluentbit.io/debian/buster buster main > /etc/apt/sources.list.d/fluentbit.list
apt update
apt install td-agent-bit
- telegraf configuration
[agent]
  interval = "10s"
  round_interval = true
  metric_batch_size = 1000
  metric_buffer_limit = 10000
  collection_jitter = "0s"
  flush_interval = "10s"
  flush_jitter = "0s"
  precision = ""
  debug = false
  quiet = false
  logfile = ""
  hostname = ""
  omit_hostname = false
[[outputs.influxdb_v2]]
  urls = ["https://my.influxdb"]
  token = "<TOKEN>"
  organization = "myorg"
  bucket = "test_telegraf"
[[inputs.cpu]]
  percpu = true
  totalcpu = true
  collect_cpu_time = false
  report_active = false
[[inputs.diskio]]
[[inputs.mem]]
- start telegraf
telegraf-1.17.2/usr/bin/telegraf --config telegraf.conf
- fluentbit configuration
[SERVICE]
    Flush        5
    Daemon       Off
    Log_Level    info
    HTTP_Server  Off
    Plugins_File /etc/td-agent-bit/plugins.conf
[INPUT]
    Name cpu
    Tag met.cpu
[INPUT]
    Name mem
    Tag met.mem
[INPUT]
    Name disk
    Tag met.disk
[FILTER]
    Name record_modifier
    Match *
    Record hostname ${HOSTNAME}
[OUTPUT]
    Name influxdb_v2
    Match met.*
    Host my.influx
    Port 443
    tls on
    tls.verify off
    org myorg
    bucket test_fluentbit
    http_token <TOKEN>
    Tag_Keys hostname
- start fluentbit
/opt/td-agent-bit/bin/td-agent-bit -c fluentbit.conf
- configuration to monitor agents (using telegraf)
[agent]
  interval = "10s"
  round_interval = true
  metric_batch_size = 1000
  metric_buffer_limit = 10000
  collection_jitter = "0s"
  flush_interval = "10s"
  flush_jitter = "0s"
  precision = ""
  debug = false
  quiet = false
  logfile = ""
  hostname = ""
  omit_hostname = false
[[outputs.influxdb_v2]]
  urls = ["https://my.influxdb"]
  token = "<TOKEN>"
  organization = "myorg"
  bucket = "test_results"
[[inputs.procstat]]
  pattern = "/opt/td-agent-bit/bin/td-agent-bit -c fluentbit.conf"
[[inputs.procstat]]
  pattern = "telegraf-1.17.2/usr/bin/telegraf --config telegraf.conf"
- start second telegraf (agent monitor)
telegraf-1.17.2/usr/bin/telegraf --config telemon.conf
Results
Left this running for over a week and these were the results:

Both lines (from fluentbit and telegraf) basically match so they produced identical telemetry data. Exception might be disk IO where they use different units and I didn’t bother to find out how to convert 🏝️
And the results that matter: fluentbit process telemetry versus telegraf
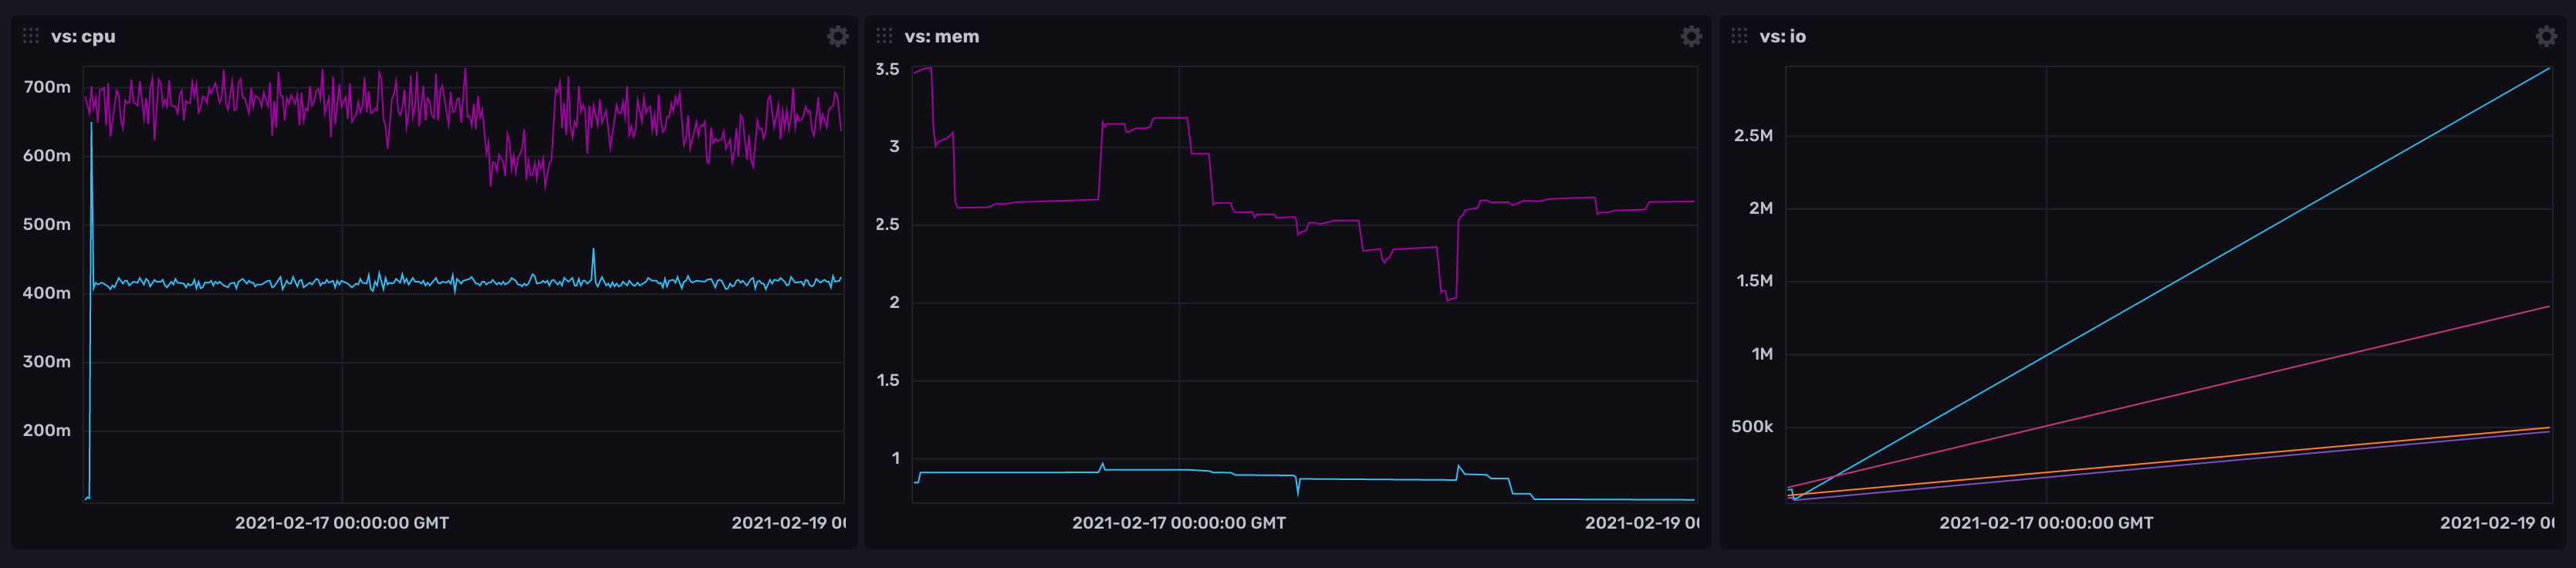
CPU
fluentbit (blue line) at 0.4% and telegraf between 0.6% and 0.7%.
we can also see the frequent ups and downs that probably come with any garbage-collected language versus the the flat(ter) line of fluentbit and its finetuned malloc and free timings.
MEM
fluentbit (blue line) uses around 10mb of memory (1% in this RPi 2) and telegraf uses between 20mb and 40mb.
Disk IO
fluentbit read count (blue line) increases much faster than telegraf’s (red line), yet write count lines are basically the same. Not entirely sure what this means though.
Conclusion
Fluentbit has a long way to go in plugin availiability and even much longer way for Windows targets… So if I had Windows machines or I needed a specific plugin and could not build it myself, I think telegraf resource usage wouldn’t be an issue.
But as I already have fluentbit setup for my own plugins, if I need any out of the core ones, I’ll keep fluentbit for the smaller footprint.